French do best
p. 32 · Read in the full issue
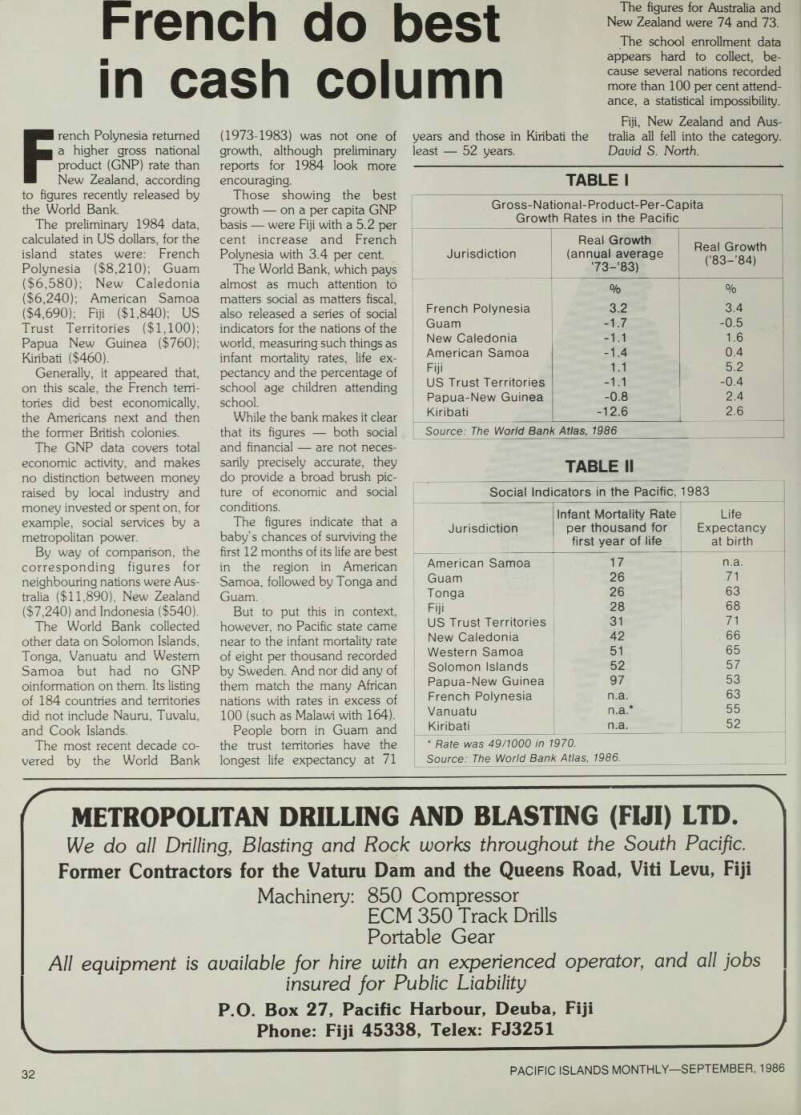
in cash column
French Polynesia returned a higher gross national product (GNP) rate than New Zealand, according to figures recently released by the World Bank.
The preliminary 1984 data, calculated in US dollars, for the island states were: French Polynesia ($8,210); Guam ($6,580); New Caledonia ($6,240); American Samoa ($4,690); Fiji ($1,840); US Trust Territories ($1,100); Papua New Guinea ($760); Kiribati ($460).
Generally, it appeared that, on this scale, the French terri tories did best economically, the Americans next and then the former British colonies.
The GNP data covers total economic activity, and makes no distinction between money raised by local industry and money invested or spent on, for example, social services by a metropolitan power.
By way of comparison, the corresponding figures for neighbouring nations were Aus tralia ($11,890), New Zealand ($7,240) and Indonesia ($540).
The World Bank collected other data on Solomon Islands, Tonga, Vanuatu and Western Samoa but had no GNP oinformation on them. Its listing of 184 countries and territories did not include Nauru, Tuvalu, and Cook Islands.
The most recent decade co vered by the World Bank
(1973-1983) was not one of growth, although preliminary reports for 1984 look more encouraging.
Those showing the best growth on a per capita GNP basis were Fiji with a 5.2 per cent increase and French Polynesia with 3.4 per cent.
The World Bank, which pays almost as much attention to matters social as matters fiscal, also released a series of social indicators for the nations of the world, measuring such things as infant mortality rates, life ex pectancy and the percentage of school age children attending school.
While the bank makes it clear that its figures both social and financial are not neces sarily precisely accurate, they do provide a broad brush pic ture of economic and social conditions.
The figures indicate that a baby’s chances of surviving the first 12 months of its life are best in the region in American Samoa, followed by Tonga and Guam.
But to put this in context, however, no Pacific state came near to the infant mortality rate of eight per thousand recorded by Sweden. And nor did any of them match the many African nations with rates in excess of 100 (such as Malawi with 164).
People bom in Guam and the trust territories have the longest life expectancy at 71
years and those in Kiribati the least 52 years.
The figures for Australia and New Zealand were 74 and 73.
The school enrollment data appears hard to collect, be cause several nations recorded more than 100 per cent attend ance, a statistical impossibility.
Fiji, New Zealand and Aus tralia all fell into the category.
David S. North.
Table 1
Gross-National-Product-Per-Capita Growth Rates in the Pacific Jurisdiction Real Growth (annual average 73-83) Real Growth (’83-84) % % French Polynesia 3.2 3.4 Guam -1.7 -0.5 New Caledonia -1.1 1.6 American Samoa -1.4 0.4 Fiji 1.1 5.2 US Trust Territories -1.1 -0.4 Papua-New Guinea -0.8 2.4 Kiribati -12.6 26 Source: The World Bank Atlas, 1986
Table Ii
Social Indicators in the Pacific, 1983 Infant Mortality Rate Life Jurisdiction per thousand for Expectancy first year of life at birth American Samoa 17 n.a.
Guam 26 71 Tonga 26 63 Fiji 28 68 US Trust Territories 31 71 New Caledonia 42 66 Western Samoa 51 65 Solomon Islands 52 57 Papua-New Guinea 97 53 French Polynesia n.a. 63 Vanuatu n.a.* 55 Kiribati n.a. 52 * Rate was 49/1000 in 1970.
Source: The World Bank Atlas, 1986.