Japan’S Pacific Trade In Figures
p. 63 · Read in the full issue
Japan continued to have an adverse trade balance with the Pacific Islands on an overall basis in 1975 and 1976. Exports were worth SUSI6I 748 000 in 1975 and SUSI 99 287 000 in 1976. Imports were valued at SUS 264 370 000 in 1975 and SUS 299 342 000 in 1976.
The main imports are copper and nickel from Papua New Guinea and New Caledonia respectively, and these, more than anything, account for the adverse trading. Fish from the Solomons and phosphate from Nauru (in 1975) helped to increase Pacific earnings in Japan.
The main exports from Japan to the Pacific are motor cars, appliances such as radios, TV sets (for resale), other items designed for sale to tourists, and processed food, mainly canned fish.
Statistics of Japan's trade with various Pacific Islands in 1975 and 1976, with the value shown in US dollars, are:
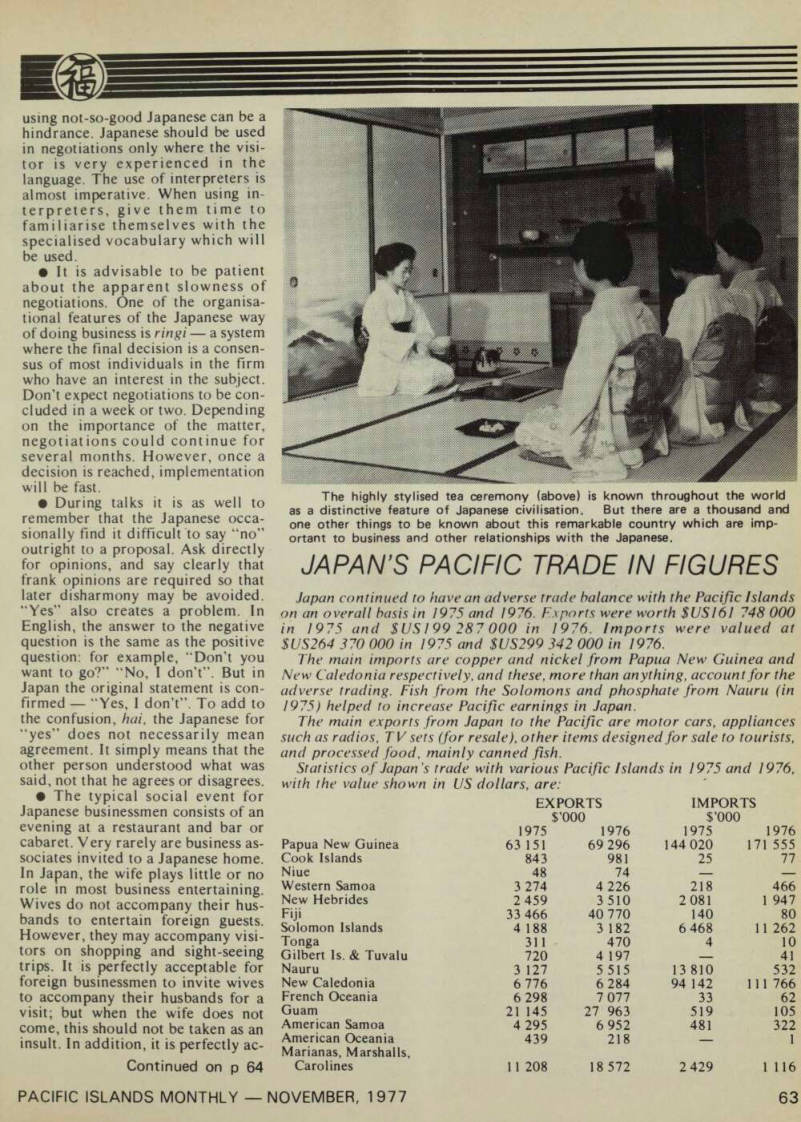
The highly stylised tea ceremony (above) is known throughout the world as a distinctive feature of Japanese civilisation. But there are a thousand and one other things to be known about this remarkable country which are imp ortant to business and other relationships with the Japanese.
Exports
Imports
$’000 $’000 1975 1976 1975 1976 Papua New Guinea 63 151 69 296 144 020 171 555 Cook Islands 843 981 25 77 Niue 48 74 — — Western Samoa 3 274 4 226 218 466 New Hebrides 2 459 3510 2 081 1 947
Fiji
33 466 40 770 140 80 Solomon Islands 4 188 3 182 6 468 11 262 Tonga 311 470 4 10 Gilbert Is. & Tuvalu 720 4 197 — 41 Nauru 3 127 5 515 13 810 532 New Caledonia 6 776 6 284 94 142 111 766 French Oceania 6 298 7 077 33 62 Guam 21 145 27 963 519 105 American Samoa 4 295 6 952 481 322 American Oceania 439 218 ] Marianas, Marshalls, Carolines 11 208 18 572 2 429 1 116