More Of The Pacific Trade
pp. 128-138 · Read in the full issue
Cake For Nz And Japan
Special for “PIM ” by JACK ASHCROFT-SMITH
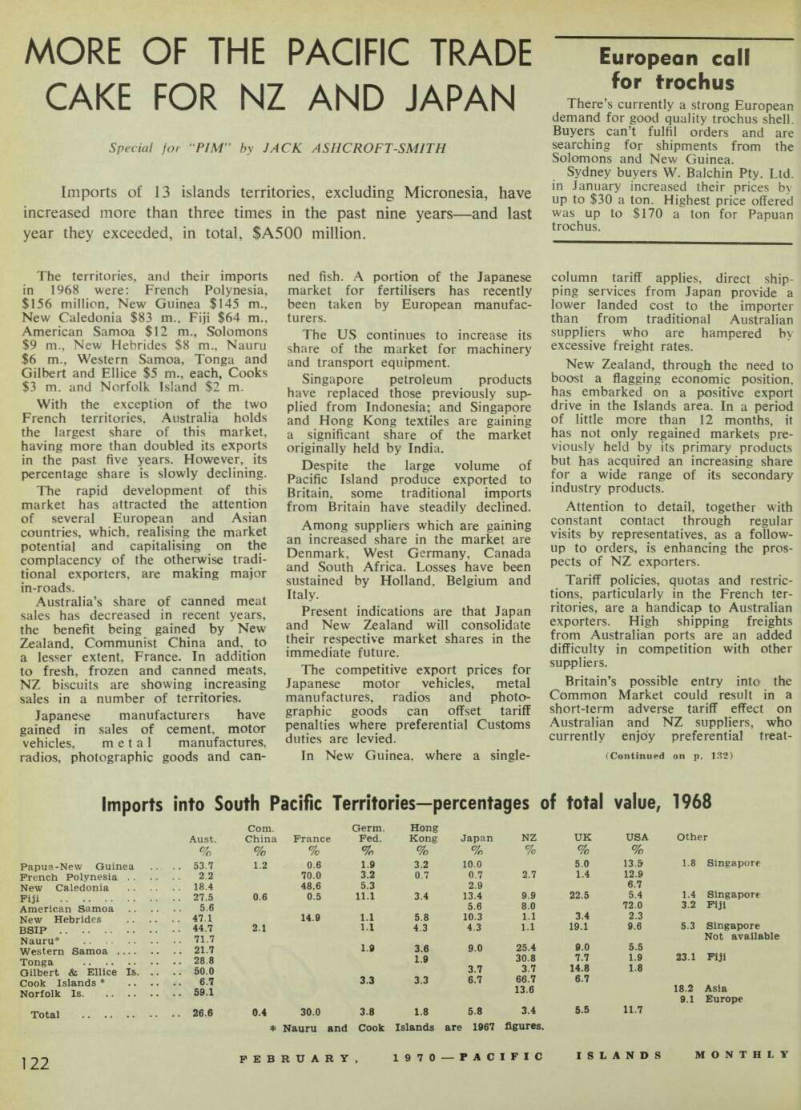
imports of 13 islands territories, excluding Micronesia, have increased more than three times in the past nine years—and last year they exceeded, in total, SASOO million.
The territories, and their imports in 1968 were: French Polynesia, $156 million, New Guinea $145 m., New Caledonia $B3 m., Fiji $64 m., American Samoa $l2 m., Solomons $9 m., New Hebrides $8 m., Nauru $6 m., Western Samoa, Tonga and Gilbert and Ellice $5 m., each, Cooks $3 m. and Norfolk Island $2 m.
With the exception of the two French territories, Australia holds the largest share of this market, having more than doubled its exports in the past five years. However, its percentage share is slowly declining.
The rapid development of this market has attracted the attention of several European and Asian countries, which, realising the market potential and capitalising on the complacency of the otherwise tradi tional exporters, are making major in-roads.
Australia’s share of canned meat sales has decreased in recent years, the benefit being gained by New Zealand, Communist China and, to a lesser extent, France. In addition to fresh, frozen and canned meats, NZ biscuits are showing increasing sales in a number of territories.
Japanese manufacturers have gained in sales of cement, motor vehicles, metal manufactures, radios, photographic goods and can
ned fish. A portion of the Japanese market for fertilisers has recently been taken by European manufacturers.
The US continues to increase its s hare of the market for machinery and transport equipment.
Singapore petroleum products have rep i ace( j those previously supplied from Indonesia; and Singapore a nd Hong Kong textiles are gaining a significant share of the market originally held by India.
Despite the large volume of Padfic Island produce exported to Britain, some traditional imports from Britain have steadily declined.
Among suppliers which are gaining an increfsed share in the market are n . w rjprmnnv fanaHa and South sustained by Holland, Belgium and Italy.
Present indications are that Japan
andTw “d s will consolXS
their respective market shares in the immediate future.
The competitive export prices for Japanese motor vehicles, metal manufactures, radios and photographic goods can offset tariff penalties where preferential Customs duties are levied.
In New Guinea, where a single-
column tariff applies, direct ship ping services from Japan provide a lower landed cost to the importer than from traditional Australian suppliers who are hampered by excessive freight rates.
New Zealand, through the need to boost a flagging economic position, has embarked on a positive export drive in the Islands area. In a period of little more than 12 months, it has not only regained markets pre viously held by its primary products but has acquired an increasing share for a wide range of its secondary industry products.
Attention to detail, together with constant contact through regular visits by representatives, as a follow up to orders, is enhancing the pros pects of NZ exporters.
Tariff policies, quotas and restric tions, particularly in the French ter ritories, are a handicap to Australian exporters. High shipping freights from Australian ports are an added difficulty in competition with other suppliers.
Britain’s possible entry into the Common Market could result in a short-term adverse tariff effect on Australian and NZ suppliers, who currently enjoy preferential treat
(Continued on p. 132)
Imports into South Pacific Territories—percentages of total value, 1968
Com.
Germ.
Hong Aust.
China France Fed.
Kong Japan NZ UK
Usa
Other % % % % % % % % % Papua-New Guinea .. 53.7 1.2 0.6 1.9 3.2 10.0 5.0 13.5 1.8 Singapore French Polynesia . . 2.2 70.0 3.2 0.7 0.7 2.7 1.4 12.9 New Caledonia . . 18.4 48,6 5.3 2.9 6.7 1.4 Singapore Fiji .. 27.5 0.6 0.5 11.1 3.4 13.4 9.9 22.5 5.4 American Samoa 5.6 5.6 8.0 3.4 72.0 3.2 Fiji New Hebrides .. 47.1 14.9 1.1 5.8 10.3 1.1 2.3 5.3 Singapore
Bsip
.. 44.7 2.1 1.1 4.3 4.3 1.1 19.1 9.6 Nauru* . . 71.7 25.4 30.8 3.7 9.0 7.7 14.8 5.5 1.9 1.8 Not available Western Samoa Tonga Gilbert & Ellice Is. .. .. 21.7 .. 28.8 . . 50.0 1.9 3.6 1.9 9.0 3.7 23.1 Fiji Cook Islands * .. . • Norfolk Is .. 6.7 . . 59.1 3.3 3.3 6.7 66.7 13.6 6.7 18.2 9.1 Asia Europe Total .. 26.6 0.4 * 30.0 Nauru and 3.8 Cook 1.8 Islands 5.8 are 1967 3.4 figures. 5.5 11.7
ment in the British Islands terri tories.
British associated territories which could be affected by a Common Market entry would be Fiji, the New Hebrides, the Solomons, Tonga and the GEIC.
Common Market policy, as re cently outlined by the Market’s executive commission, requires Britain to adhere to market Customs tariffs as a prerequisite for entry. This requirement will fundamentally alter conditions of trade between Britain and the British Commonwealth through substitution of Common Market preferences for those cur rently applying to the Common wealth.
In its report, the commission notes that Britain has not stated the need for special solutions in favour of the Commonwealth’s developed countries.
The Common Market (1958) Rome Treaty includes provisions for extension of preferences to ex-colo nies of member nations. Preference is limited mainly to underdeveloped countries and would have little effect on imports to dependencies of mem bers in the Pacific area.
Existing contracts with Britain for
sales of produce from the Islands territories can be expected to be honoured, being gradually phased out over a number of years accord ing to a “harmony of interests”.
This mainly applies to copra.
Australia could lose further to NZ for some commodities currently supplied to the Islands.
Past experience in the French terri tories does not indicate that there would be a vast in-flow of competi tion from other Common Market member countries. The established Island traders tend to obtain supplies from the more stable and competi tive sources.