Ie State Of Papua-New Guinea
p. 41 · Read in the full issue
resting—But Year Old
• We received the printed annual reports of the Territory of pua and New Guinea for the statistical year 1956-57 in July, two ys after the close of accounts for the statistical year 1957-58.
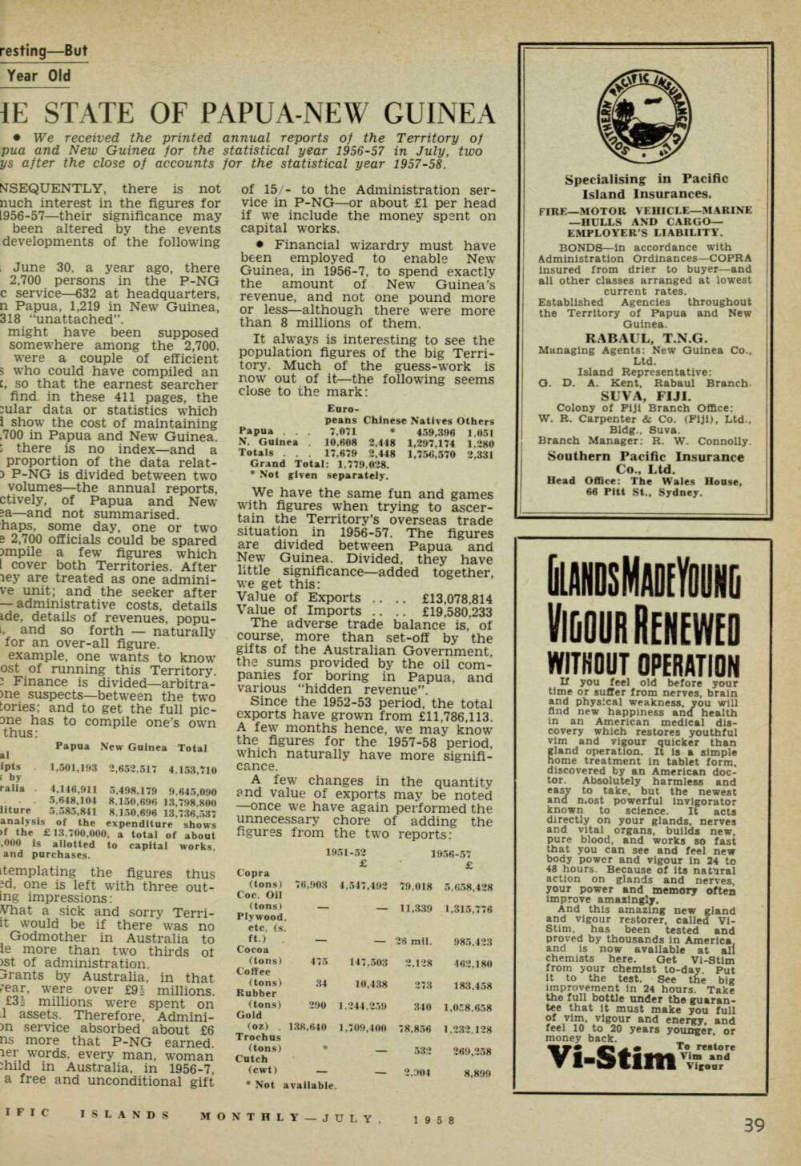
NSEQUENTLY, there is not nuch interest in the figures for L 956-57 —their significance may been altered by the events developments of the following . June 30, a year ago, there 2,700 persons in the P-NG c service—632 at headquarters, n Papua, 1,219 in New Guinea, 318 “unattached”, might have been supposed somewhere among the 2,700. were a couple of efficient 5 who could have compiled an c, so that the earnest searcher find in these 411 pages, the :ular data or statistics which 1 show the cost of maintaining ,700 in Papua and New Guinea, i there is no index—and a proportion of the data relat -3 P-NG is divided between two volumes—the annual reports, ctively, of Papua and New 3a —and not summarised, haps, some day, one or two s 2,700 officials could be spared Dmpile a few figures which I cover both Territories. After ley are treated as one admini ve unit; and the seeker after administrative costs, details ide, details of revenues, popu i, and so forth naturally for an over-all figure, example, one wants to know ost of running this Territory. 3 Finance is divided—arbitra ge suspects—between the two tories; and to get the full pic- Dne has to compile one’s own thus: Papua New Guinea Total al ipts . 1,501,193 2,652.517 4,153,710 i by ralia . 4,146.911 5,498,179 9.645,090 ■ 5,648,104 8.150.696 13,798.800 iiture 5.585,841 8.150,696 13,736,537 analysis of the expenditure shows >f the £13,700,000, a total of about ,000 is allotted to capital works, and purchases. itemplating the figures thus 3d, one is left with three out ing impressions; Vhat a sick and sorry Terri it would be if there was no Godmother in Australia to le more than two thirds ot >st of administration.
Grants by Australia, in that fear, were over millions. millions were spent on 1 assets. Therefore, Admini m service absorbed about £6 ns more that P-NG earned, ler words, every man, woman 3hild in Australia, in 1956-7, a free and unconditional gift
of 15/- to the Administration ser vice in P-NG—or about £1 per head if we include the money spent on capital works. • Financial wizardry must have been employed to enable New Guinea, in 1956-7, to spend exactly the amount of New Guinea’s revenue, and not one pound more or less—although there were more than 8 millions of them.
It always is interesting to see the population figures of the big Terri tory. Much of the guess-work is now out of it—the following seems close to the mark:
We have the same fun and games with figures when trying to ascer tain the Territory’s overseas trade situation in 1956-57. The figures are divided between Papua and New Guinea. Divided, they have little significance—added together, w F e get this: Value of Exports .. .. £13,078,814 Value of Imports .. .. £19,580,233 The adverse trade balance is, of course, more than set-off by the gifts of the Australian Government, the sums provided by the oil com panies for boring in Papua, and various “hidden revenue”.
Since the 1952-53 period, the total exports have grown from £11,786,113.
A few months hence, we may know the figures for the 1957-58 period, which naturally have more signifi cance.
A few changes in the quantity and value of exports may be noted —once we have again performed the unnecessary chore of adding the figures from the two reports:
1951-53 1956-57 Copra £ £ (tons) Coc. Oil 76.903 4,547,493 79,018 5,658,438 (tons) Plywood, etc, (s. — — 11,339 1,315,776 ft.) , Cocoa — — 36 mil. 985.433 (tons) Coffee 475 147,503 2,138 463,180 (tons) Rubber 34 10,438 373 183,458 (tons) Gold 390 1.344,359 340 1,058.658 (oz) .
Trochus 138,640 1,709.400 78.856 1.333,128 (tons) Cutch * 533 369,258 (cwt) — * Not available. 3,004 8,899