Over Quarter-Million People
pp. 19-20 · Read in the full issue
Now In Fiji
Recent Census Shows Rapid Increase of Indians
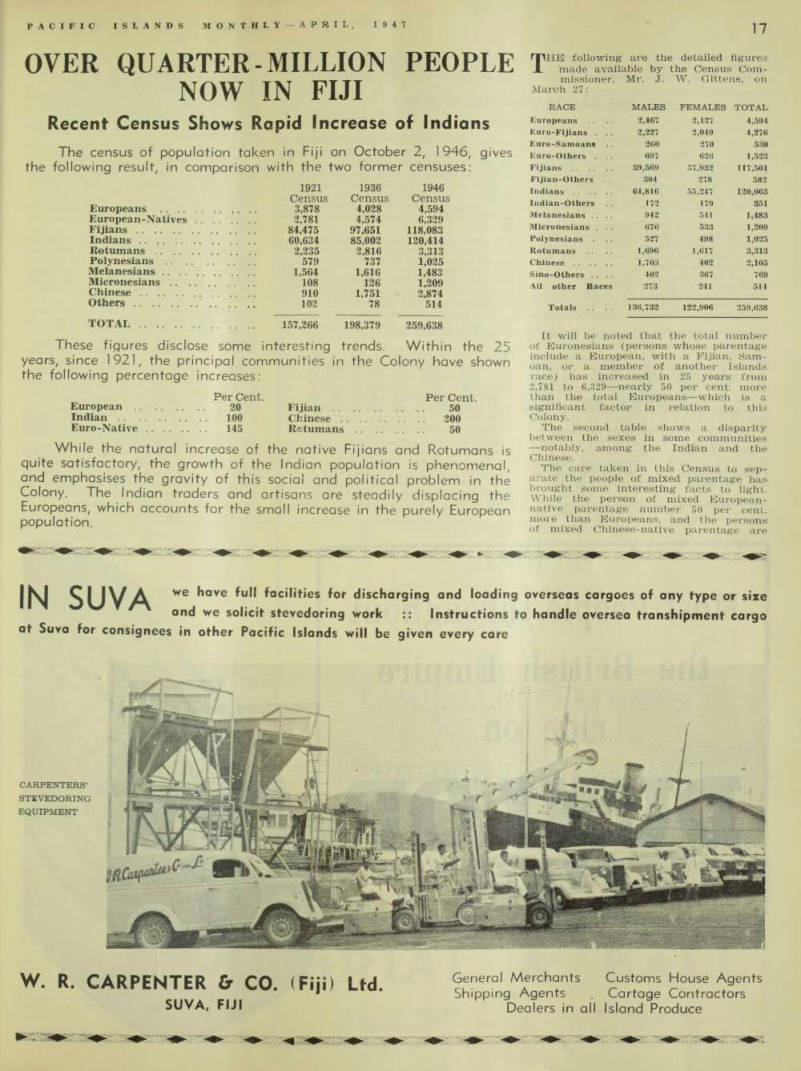
The census of population taken in Fiji on October 2, 1946, gives the following result, in comparison with the two former censuses:
These figures disclose some interesting trends. Within the 25 years, since 1921, the principal communities in the Colony have shown the following percentage increases:
While the natural increase of the native Fijians and Rotumans is quite satisfactory, the growth of the Indian population is phenomenal, and emphasises the gravity of this social and political problem in the Colony. The Indian traders and artisans are steadily displacing the Europeans, which accounts for the small increase in the purely European population.
THE following are the detailed figures made available by the Census Com missioner, Mr. J. W. Gittens, on March 27:
It will be noted that the total number of Euronesians (persons whose parentage include a European, with a Fijian, Sam oan, or a member of another Islands race) has increased in 25 years from 2,781 to 6,329 —nearly 50 per cent, more than the total Europeans—which is a significant factor in relation to this Colony.
The second table shows a disparity between the sexes in some communities —notably, among the Indian and the Chinese.
The care taken in this Census to sep arate the people of mixed parentage has brought some interesting facts to light.
While the person of mixed European native parentage number 50 per cent, more than Europeans, and the persons of mixed Chinese-native parentage are
1921 1936 1946 Census Census Census Europeans . .. 3,878 4,028 4,594 European-Natives . .. 2,781 4,574 6,329 Fijians . .. 84,475 97,651 118,083 Indians 85,002 120,414 Rotumans . .. 2,235 2,816 3,313 Polynesians 579 737 1,025 Melanesians . .. 1,564 1,616 1,483 Micronesians . . 108 126 1,209 Chinese 1,751 2,874 Others 78 514
Total
. .. 157,266 198,379 259,638
Per Cent.
Per Cent.
European . . .. .. .. 20 Fijian .. .. 50 Indian ... 100 Chinese 200 Euro-Native . . . . ... 145 Rctumans ... 50
Race
Males
Females
Total
Europeans 2,467 2,127 4,594 Euro-Fijians . 2,227 2,049 4,276 Euro-Samoans 26(1 270 530 Euro-Others . 697 626 1,523 Fijians 59,569 57,932 117,501 Fijian-Others 304 278 582 Indians .. .. 64,316 55,247 120,063 Indian-Others 172 179 851 Melanesians . . 942 541 1,483 Micronesians . 676 533 1,209 Polynesians 527 498 1,025 Rotumans 1,696 1,617 3,313 Chinese . . . . 1,703 402 2,105 Sino-Others .. 402 367 769 Ail other Races 273 241 514 Totals .. 136,732 122,906 259,638
about one quarter of the total community classified as Chinese, there are only 351 persons of mixed Indian-native parentage,
compared with over 120,000 pure Indians.
The Census Commissioner’s full report should be ready in May or June.