World's Copra
p. 34 · Read in the full issue
Output
1940 Production Was 40 Per Cent.
Below Normal
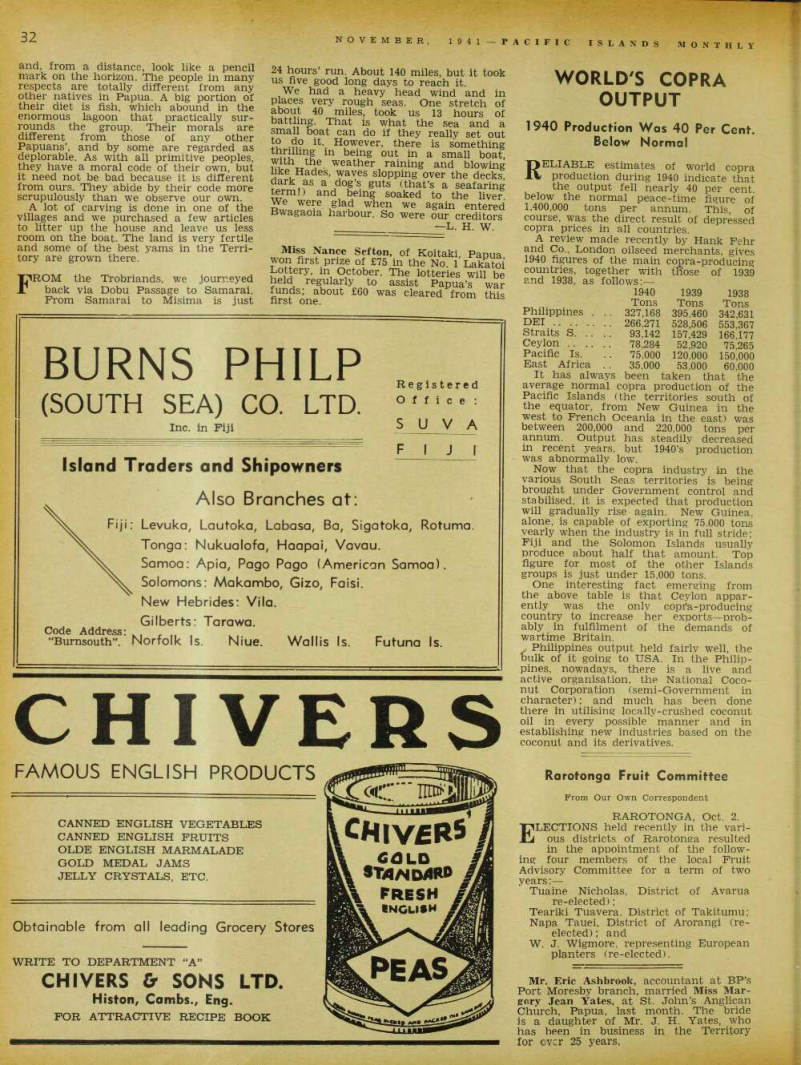
RELIABLE estimates of world copra production during 1940 indicate that the output fell nearly 40 per cent, below the normal peace-time figure of 1,400,000 tons per annum. This, of course, was the direct result of depressed copra prices in all countries.
A review made recently by Hank Fehr and Co., London oilseed merchants, gives 1940 figures of the main copra-producing countries, together with those of 1939 and 1938, as follows:
average normal copra production of the Pacific Islands (the territories south of the equator, from New Guinea in the west to French Oceania in the east) was between 200,000 and 220,000 tons per annum. Output has steadily decreased in recent years, but 1940’s production was abnormally low.
Now that the copra industry in the various South Seas territories is being brought under Government control and stabilised, it is expected that production will gradually rise again. New Guinea, alone, is capable of exporting 75.000 tons yearly when the industry is in full stride; Fiji and the Solomon Islands usually produce about half that amount. Top figure for most of the other Islands groups is just under 15,000 tons.
One interesting fact emerging from the above table is that Ceylon appar ently was the only copfa-producing country to increase her exports—prob ably in fulfilment of the demands of wartime Britain. > Philippines output held fairly well, the bulk of it going to USA. In the Philip pines, nowadays, there is a live and active organisation, the National Coco nut Corporation (semi-Government in character); and much has been done there in utilising locally-crushed coconut oil in every possible manner and in establishing new industries based on the coconut and its derivatives.
1940 1939 1938 Tons Tons Tons Philippines . .. 327,168 395,460 342,631
Dei
266,271 528,506 553,367 Straits S 93,142 157,429 166,177 Ceylon 78,284 52,920 75.265 Pacific Is. 75,000 120.000 150,000 East Africa .. 35,000 53,000 60.000 It has always been taken that the