Copra and Other Production.
p. 16 · Read in the full issue
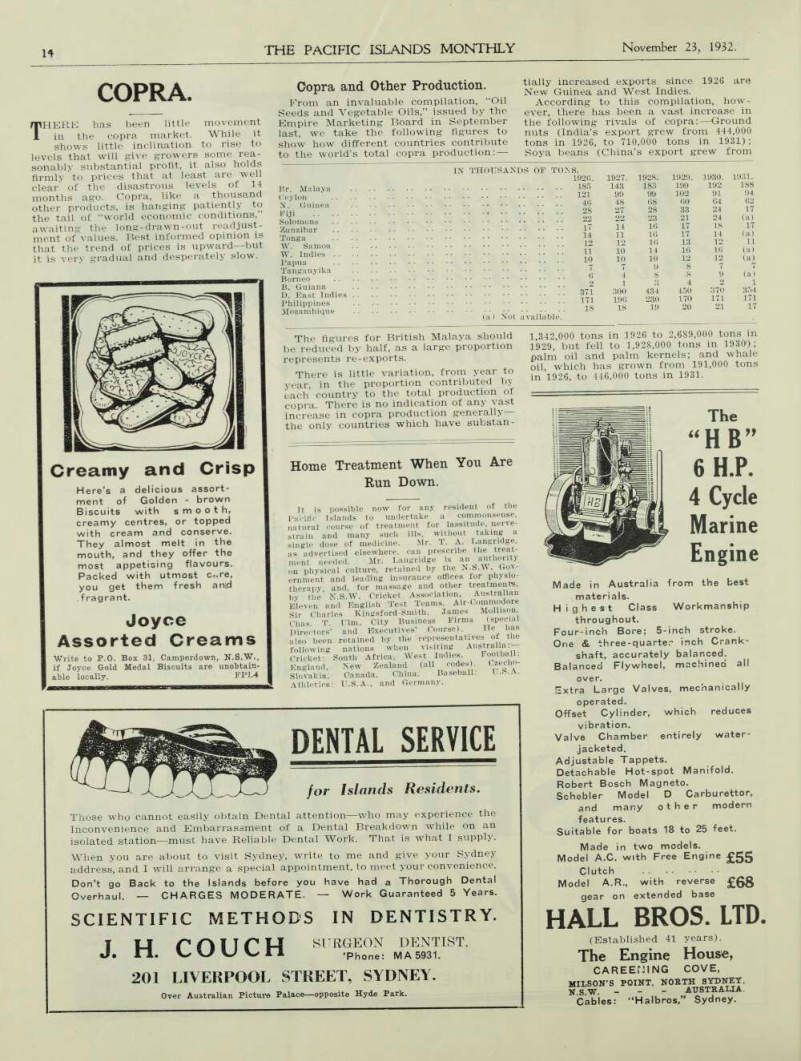
From an invaluable compilation, “Oil Seeds and Vegetable Oils,” issued by the Empire Marketing Board in September last, we take the following figures to show how different countries contribute to the world’s total copra production:
The figures for British Malaya should be reduced by half, as a large proportion represents re-exports.
There is little variation, from year to year in the proportion contributed by each country to the total production of copra. There is no indication of any vast increase in copra production generally the only countries which have substan
tially increased exports since 1926 are New Guinea and West Indies.
According to this compilation, how ever, there has been a vast increase in the following rivals of copra: —Ground nuts (India’s export grew from 444,000 tons in 1926, to 710,000 tons in 1931); Soya beans (China’s export grew from
1 342,000 tons in 1926 to 2,689,000 tons in 3 929, but fell to 1,928,000 tons in 1930); palm oil and palm kernels; and whale oil, which has grown from 191,000 tons in 1926, to 446,000 tons in 1931.
Br. Malaya Fiji Tonga Tanganyika Philippines
In Thousands Of Tons.
1926. 121 28 22 14 12 11 10 6 2 371 171 (a) Not available. 1927. 143 99 48 27 22 14 11 12 10 10 7 4 1 300 196 18 1928. 183 99 68 28 23 16 16 16 14 10 J 230 19 1929. 199 102 60 33 21 17 17 13 16 12 8 8 4 450 170 20 1930. 192 91 64 24 24 18 14 12 16 12 7 9 2 370 171 21 1931. 188 94 62 17 (a) 17 (a) 11 (a) (a) 1 354 171 17