The Stock Market
p. 168 · Read in the full issue
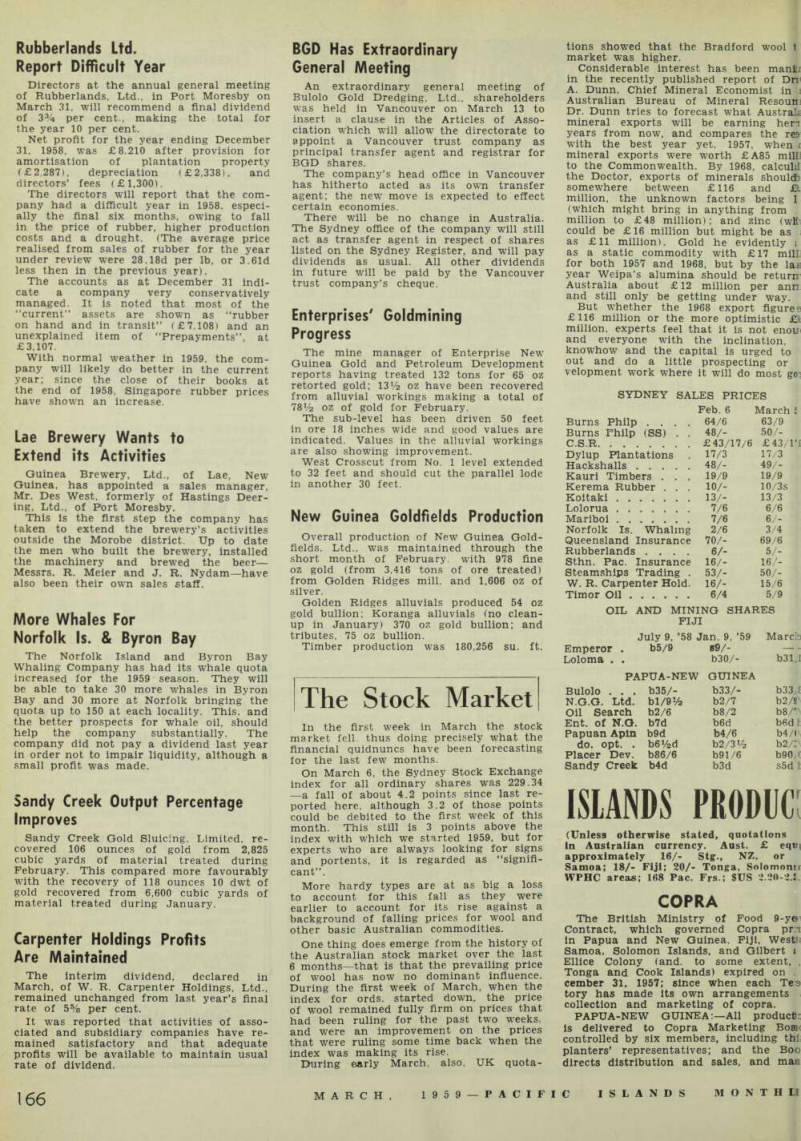
In the first week in March the stock market fell, thus doing precisely what the financial quidnuncs have been forecasting for the last few months.
On March 6, the Sydney Stock Exchange index for all ordinary shares was 229.34 —a fall of about 4.2 points since last re ported here, although 3.2 of those points could be debited to the first week of this month. This still is 3 points above the index with which we started 1959, but for experts who are always looking for signs and portents, it is regarded as “signifi cant”.
More hardy types are at as big a loss to account for this fall as they were earlier to account for its rise against a background of falling prices for wool and other basic Australian commodities.
One thing does emerge from the history of the Australian stock market over the last 6 months—that is that the prevailing price of wool has now no dominant influence.
During the first week of March, when the index for ords. started down, the price of wool remained fully firm on prices that had been ruling for the past two weeks, and were an improvement on the prices that were ruling some time back when the index was making its rise.
During early March, also, UK quota
tions showed that the Bradford wool 1 market was higher.
Considerable interest has been manirr in the recently published report of Dm A. Dunn, Chief Mineral Economist in i Australian Bureau of Mineral Resounj Dr. Dunn tries to forecast what Australis mineral exports will be earning hen years from now, and compares the res with the best year yet. 1957, when r mineral exports were worth £ABS milli to the Commonwealth. By 1968, calculi! the Doctor, exports of minerals should) somewhere between £ll6 and B. million, the unknown factors being I (which might bring in anything from million to £4B million); and zinc (wit could be £l6 million but might be as . as £ll million). Gold he evidently i as a static commodity with £l7 milli for both 1957 and 1968, but by the las year Weipa’s alumina should be return- Australia about £l2 million per ann and still only be getting under way.
But whether the 1968 export figures £ll6 million or the more optimistic £3t million, experts feel that it is not enom and everyone with the inclination, knowhow and the capital is urged to out and do a little prospecting or velopment work where it will do most go?
Sydney Sales Prices
Oil And Mining Shares
Fiji
July 9, ’5B Jan. 9, ’59 March Emperor . b5/9 »9/- Loloma . . b3O/- bSl.i
Feb. 6 March i Burns Philp ... 64/6 63/9 Burns Philp (SS) . . 48/- 50/-
C.S.R
£43/17/6 £43/1*1 Dylup Plantations 17/3 17/3 Hackshalls 48/- 49/- Kauri Timbers . . . 19/9 19/9 Kerema Rubber . . . 10/- 10/3S Koitaki 13/- 13/3 Lolorua 7/6 6/6 Maribol 7/6 6/- Norfolk Is. Whaling 2/6 3/4 Queensland Insurance 70/- 69/6 Rubberlands ... 6/- 5/- Sthn. Pac. Insurance 16/- 16/- Steamships Trading . 53/- 50/- W. R. Carpenter Hold. 16/- 15/6 Timor Oil 6/4 5/9
Papua-New
Guinea
Bulolo . . . b35/b33/b33,l N.G.G. Ltd. bl/9V 2 b2/7 b2/r Oil Search b2/6 b8/2 b8/ r ' Ent. of N.O. b7d b6d bed t Papuan Apln b9d b4/6 b4/( do. opt. . b6V 2 d b2/3V a b2/:' Placer Dev. b86/6 b91/6 b90,f Sandy Creek b4d b3d s5d I